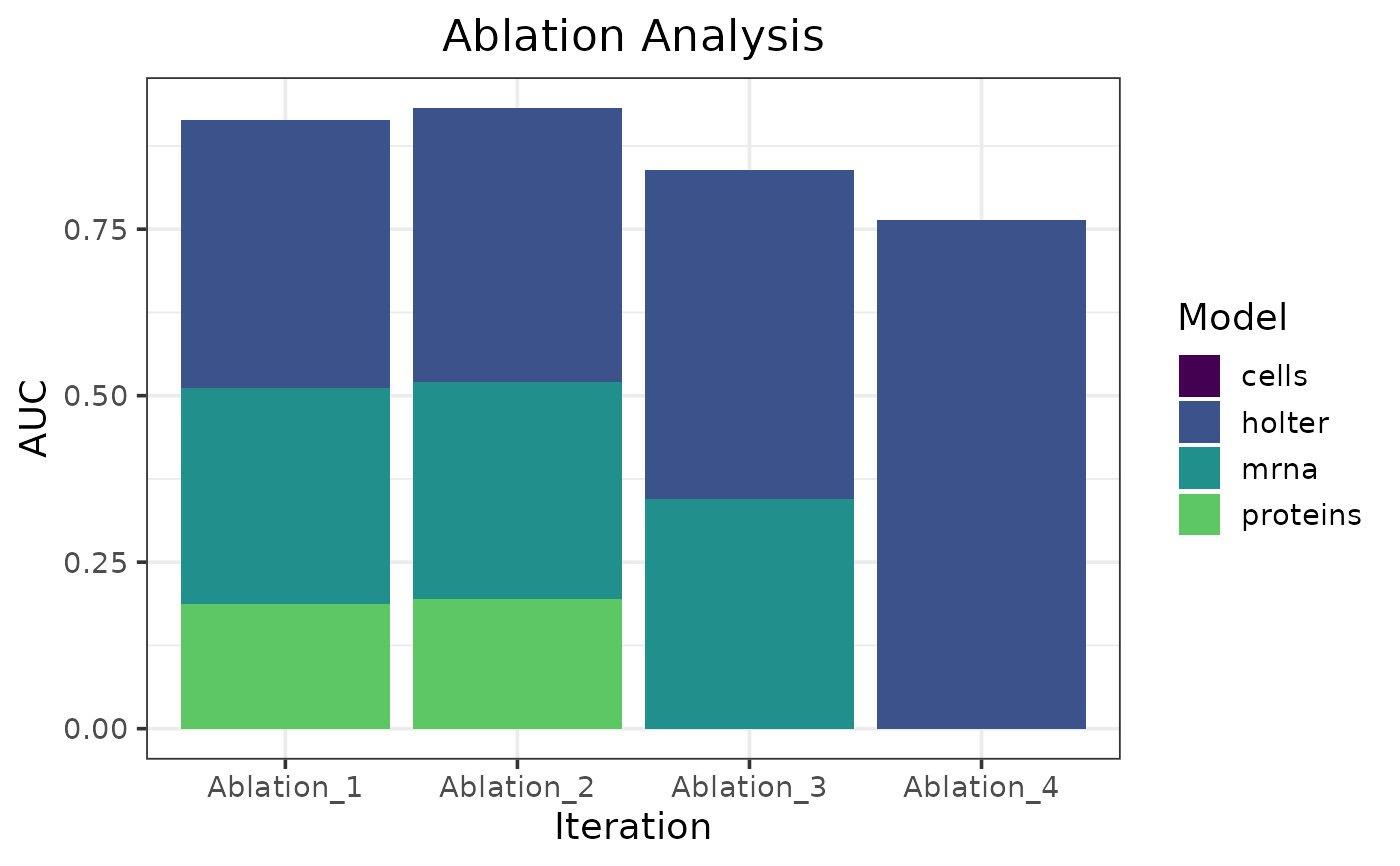
Make a bar plot of an ablation analysis for a caret_stack.
Source: R/caret_stack.R
plot_ablation.caret_stack.RdMakes a bar plot from compute_ablation.caret_stack output.
Usage
# S3 method for class 'caret_stack'
plot_ablation(object, metric_function, metric_name, reverse = FALSE, ...)
Arguments
- object
A
caret_stackobject.- metric_function
A function that takes two arguments
(predictions, target)and returns a single numeric value representing the metric to compute (e.g., RMSE, accuracy, AUC).predictionsare the ensemble's out-of-fold predicted values andtargetis the response vector.- metric_name
The name of the metric. Used as a row label in the returned
data.frame.- reverse
Logical, controls the direction to ablate in. If
FALSE, the lowest contributing model is removed at each iteration. IfTRUE, the highest contributing model is removed. Default isFALSE.- ...
Not used. Included for S3 compatibility.
Examples
# Load pre-trained example caret_stack object
data(heart_failure_stack)

# Since the example stack is a binary classifier,
# this metric function needs to take in predictions (floats) and
# ground truth (binary vector), and produce a single number.
metric_fun <- function(preds, target) {
  pROC::roc(response = target, predictor = preds, quiet = TRUE)$auc
}

plot_ablation(heart_failure_stack, metric_fun, "AUC")