Make a bar plot of feature level for a caret_stack.
Source: R/caret_stack.R
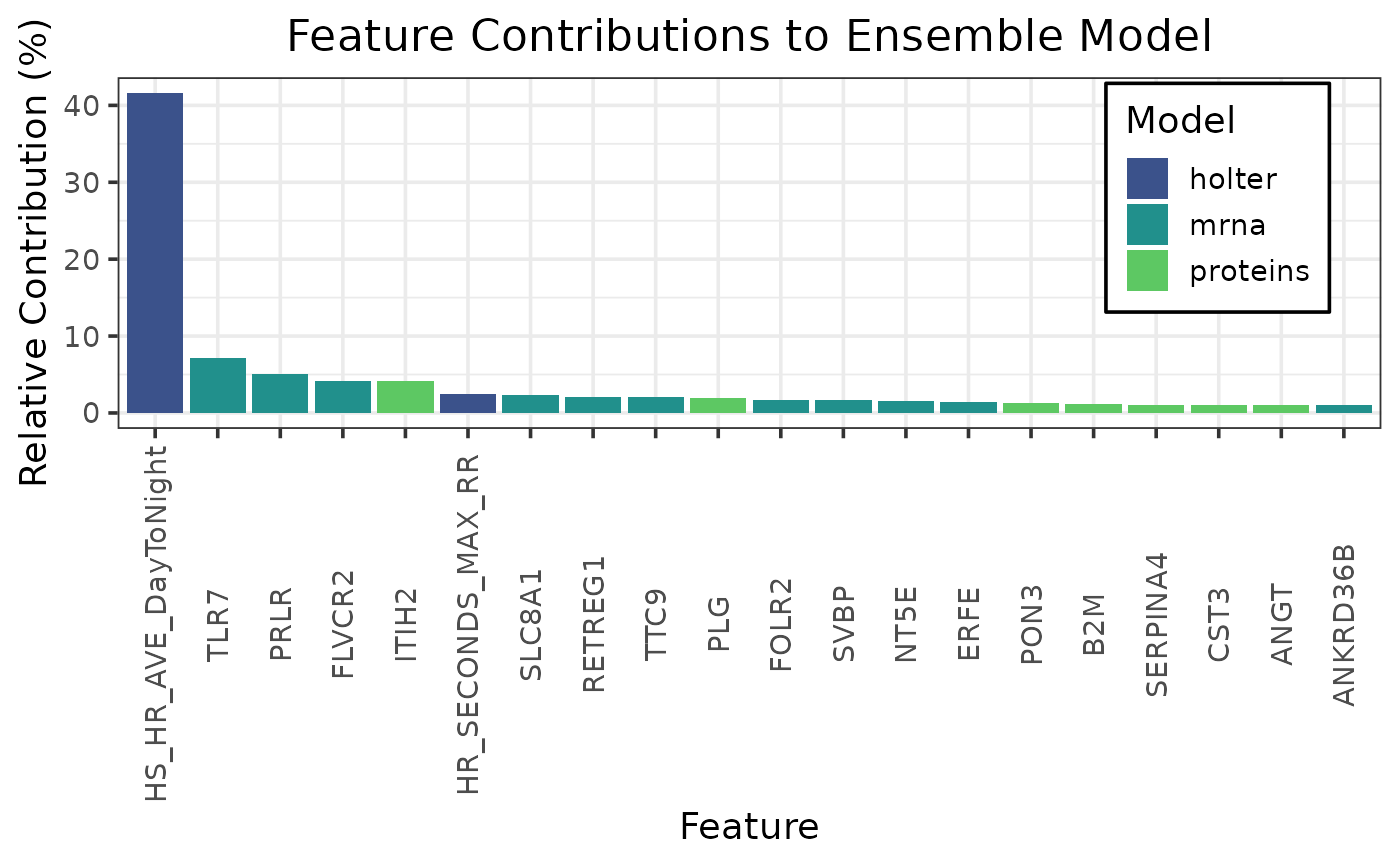
plot_feature_contributions.caret_stack.RdConstructs a bar plot with the output of compute_feature_contributions.caret_stack.
Usage
# S3 method for class 'caret_stack'
plot_feature_contributions(object, n_features = 20, ...)Examples
# Load pre-trained example caret_stack object
data(heart_failure_stack)

plot_feature_contributions(heart_failure_stack)